State Tax Burden

One way to look at State tax burden when comparing one state with another, is to use the same weighting factor (or value, or importance) for each category (sales tax, income tax, property tax). If you value each category the same, that is, sales tax is just as important to you as income tax which is just as important as property tax, the results are as follows.
Using the data from an earlier post, Lowest to Highest Taxes by State, each tax category was individually ranked from lowest to highest for each state (sales tax, income tax, and property tax).
The data was ‘normalized’, meaning that the values were processed in a way that makes it possible to be compared against other values (apples to apples).
Then, in this example, the tax category ‘normalized’ values were added together for each state, and then sorted from lowest to highest.
State Tax Burden (sales, income, property)
The same weight is applied to each category
lowest to highest (best to worst, most favorable to least favorable)
1 Wyoming
2 Florida
3 South Dakota
4 Delaware
5 West Virginia
6 Nevada
7 Kentucky
8 New Hampshire
9 Arkansas
10 Michigan
11 New Mexico
12 North Dakota
13 Colorado
14 Alaska
15 Tennessee
16 Indiana
17 Pennsylvania
18 Ohio
19 Hawaii
20 Texas
21 Montana
22 Oklahoma
23 Mississippi
24 Utah
25 Louisiana
26 Alabama
27 Idaho
28 Georgia
29 Virginia
30 Arizona
31 Maryland
32 Maine
33 Washington
34 North Carolina
35 South Carolina
36 Massachusetts
37 Oregon
38 Connecticut
39 Wisconsin
40 D.C.
41 Missouri
42 Iowa
43 Nebraska
44 Kansas
45 New Jersey
46 Minnesota
47 Rhode Island
48 Illinois
49 Vermont
50 New York
51 California

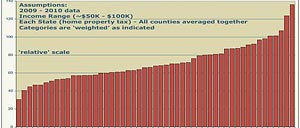
Another way to look at the tax burden data is to apply more importance to certain categories in order to better represent your own concerns. In the following example, the most weight (or importance) has been applied to property tax (it never goes away – even after retirement), followed by income tax, followed by sales tax.
The specific weighting factors chosen are,
property tax (4x)
income tax (3x)
sales tax (2x)
This particular weighting is designed to better represent an example where someone is researching a move, and will be earning income that fits more-or-less the average U.S. worker -roughly $60K (state income tax rates were mostly the same between $50K – $100K), and someone who will be purchasing a home with the likelihood of retiring there and is concerned about property taxes (which will never go away – even after retirement).
State Tax Burden (sales-income-property)
Category weighting is applied as described above.
lowest to highest (best to worst, most favorable to least favorable)
1 Wyoming
2 Florida
3 West Virginia
4 Tennessee
5 Delaware
6 New Mexico
7 Nevada
8 Arkansas
9 South Dakota
10 Kentucky
11 Indiana
12 Alabama
13 Mississippi
14 Louisiana
15 Oklahoma
16 Colorado
17 Arizona
18 Michigan
19 Ohio
20 Utah
21 Hawaii
22 Pennsylvania
23 Texas
24 Alaska
25 North Dakota
26 Georgia
27 Montana
28 South Carolina
29 New Hampshire
30 Idaho
31 Washington
32 North Carolina
33 Maine
34 Virginia
35 Maryland
36 Missouri
37 Oregon
38 Kansas
39 Massachusetts
40 Iowa
41 D.C.
42 Connecticut
43 Wisconsin
44 Illinois
45 Nebraska
46 Minnesota
47 New Jersey
48 Rhode Island
49 Vermont
50 New York
51 California
In addition, it may be helpful to know a little more about State money management and State fiscal responsibility. The following is a list of State budget deficit shortfalls projected for FY 2011 and 2012.
Data acquired from cbpp.org
States with the worst budget deficit 2011
(shortfall as percentage of budget)
Nevada (55%)
Illinois (40%)
New Jersey (38%)
Arizona (37%)
Maine (35%)
North Carolina (31%)
Vermont (31%)
Connecticut (29%)
New Hampshire (27%)
South Carolina (26%)
States with the worst budget deficit forecast 2012
(shortfall as percentage of budget)
Nevada (45%)
Illinois (45%)
New Jersey (37%)
Texas (32%)
California (29%)
Minnesota (25%)
Oregon (25%)
Louisiana (22%)
Connecticut (21%)
North Carolina (20%)
Now that we know who the worst State budget offenders are, let’s see which states do better with their fiscal management and have the smallest budget deficit, if any.
States with the least budget deficit 2011
Alaska (no deficit)
Alabama (no deficit)
Arkansas (no deficit)
North Dakota (no deficit)
Wyoming (no deficit)
Indiana (2%)
Montana (4%)
West Virginia (4%)
Iowa (6%)
Massachusetts (6%)
