This United States National Debt Graph Is Surging
The following stunning graph of the United States national debt (since 1950) reveals not only the surge in debt since Nixon canceled the direct convertibility of the United States dollar to gold in 1971, but it shows in horrifying detail how the situation has proceeded to get much much worse since the 2008 meltdown as the nation’s dollar debt soars up the steep incline of what looks like an exponential curve…
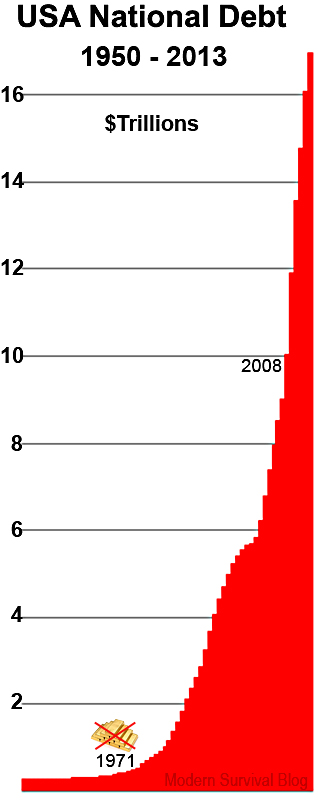
THIS WILL NOT END WELL…
U.S. NATIONAL HISTORIC DEBT
Debt as of this post, 2014-APR
($17,548,511,000,000)
9/30/2013 $16,971,773,150,089*
9/30/2012 $16,066,241,407,386
9/30/2011 $14,790,340,328,557
9/30/2010 $13,561,623,030,892
9/30/2009 $11,909,829,003,512
9/30/2008 $10,024,724,896,912
9/30/2007 $9,007,653,372,262
9/30/2006 $8,506,973,899,215
9/30/2005 $7,932,709,661,724
9/30/2004 $7,379,052,696,330
9/30/2003 $6,783,231,062,744
9/30/2002 $6,228,235,965,597
9/30/2001 $5,807,463,412,200
9/30/2000 $5,674,178,209,887
9/30/1999 $5,656,270,901,615
9/30/1998 $5,526,193,008,898
9/30/1997 $5,413,146,011,397
9/30/1996 $5,224,810,939,136
9/29/1995 $4,973,982,900,709
9/30/1994 $4,692,749,910,013
9/30/1993 $4,411,488,883,139
9/30/1992 $4,064,620,655,522
9/30/1991 $3,665,303,351,697
9/28/1990 $3,233,313,451,777
9/29/1989 $2,857,430,960,187
9/30/1988 $2,602,337,712,041
9/30/1987 $2,350,276,890,953
9/30/1986 $2,125,302,616,658
9/30/1985 $1,823,103,000,000
9/30/1984 $1,572,266,000,000
9/30/1983 $1,377,210,000,000
9/30/1982 $1,142,034,000,000
9/30/1981 $997,855,000,000
9/30/1980 $907,701,000,000
9/30/1979 $826,519,000,000
9/30/1978 $771,544,000,000
9/30/1977 $698,840,000,000
6/30/1976 $620,433,000,000
6/30/1975 $533,189,000,000
6/30/1974 $475,059,815,732
6/30/1973 $458,141,605,312
6/30/1972 $427,260,460,941
6/30/1971 $398,129,744,456
6/30/1970 $370,918,706,950
6/30/1969 $353,720,253,841
6/30/1968 $347,578,406,426
6/30/1967 $326,220,937,795
6/30/1966 $319,907,087,795
6/30/1965 $317,273,898,984
6/30/1964 $311,712,899,257
6/30/1963 $305,859,632,996
6/30/1962 $298,200,822,721
6/30/1961 $288,970,938,610
6/30/1960 $286,330,760,848
6/30/1959 $284,705,907,078
6/30/1958 $276,343,217,746
6/30/1957 $270,527,171,896
6/30/1956 $272,750,813,649
6/30/1955 $274,374,222,803
6/30/1954 $271,259,599,108
6/30/1953 $266,071,061,639
6/30/1952 $259,105,178,785
6/29/1951 $255,221,976,815
6/30/1950 $257,357,352,351
* 2013 debt extrapolated from known present debt (2014-APR) and known debt from 2012-SEP.
Observation: The overall accumulated debt is staggering, especially the acceleration of debt in reference to the span of time. There are other ways to visualize our national debt (in relation to GDP, or other references), however looking at the plain dollar amount is ‘telling’ in its own simple way.
The United States Debt Meltdown, And The Coming Dollar Collapse
