How SDO captures images of the Sun – Solar Dynamic Observatory

Permalink

The upcoming solar cycle maximum is due to peak during 2012 and 2013. We will be seeing more and more images of the sun as an increasing number of sunspots, solar flares, and CME’s (coronal mass ejection) get our attention and make the news over the next few years.
Given the interest of this blog (and our readers) in survival preparedness as it relates to current events, both man-made and geophysical, including those from our sun, I thought it would be of interest to post a few basics about where these solar images come from.
During February 2010, NASA launched its Solar Dynamic Observatory (SDO) into geosynchronous orbit above the Earth.

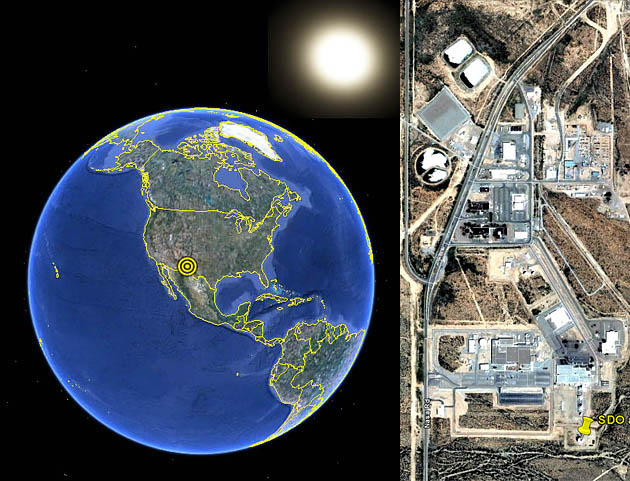
The SDO orbit is 22,000 miles above the Earth, located at 102 degrees West longitude, inclined at 28.5 degrees.
It is stationary (maintaining the same orbital speed of the Earth) and almost directly over the NASA White Sands Complex near Las Cruces, New Mexico where two 18 meter antennas point straight up to pick up the signal and data stream from SDO.
Here is the view as it would be seen from SDO, as if looking back towards Earth (perspective to scale) 22,000 miles above its geosynchronous position near Las Cruces.

Attached to the SDO are four very special built telescopes that always point at the sun. The assembly of telescopes is called the Atmospheric Imaging Assembly, or AIA.

Every 10 seconds, the AIA captures images of the sun in 10 different spectral bands (wavelengths). The data is constantly beamed down to Earth at 150Mbps, about 1.5 terabytes of data per day, in a very high resolution format of 4096 x 4096 pixels per image.
SDO images of the sun can be viewed at the NASA SDO website.
The images span a total of seven EUV (Extreme Ultra Violet), one UV (Ultra Violet) and two visible channels enabling visibility of solar temperatures ranging from the photosphere to the corona while viewing magnetic fields and plasma.
The ten waveband images are actually representative of the temperature of gases ranging from 10,000 to 30,000,000 Kelvin (~20,000 to 50,000,000 Fahrenheit).
List of AIA wavelength channels (Angstroms)
- Visible wavelength sees the photosphere
- 1700 (photosphere)
- 1600 (upper photosphere)
- 335 (corona)
- 304 (chromosphere)
- 211 (corona)
- 193 (corona and hot flare plasma)
- 171 (upper corona)
- 131 (flaring regions)
- 94 (flaring regions)
Upper Layers of the sun
Photosphere
- The light producing region that we can see
- 500 km deep, thin like the layer of an onion
- Temperature (Kelvin) 4,500 (bottom of layer) – 7,500 (top of layer)
- Temperature (Fahrenheit) 8,000 – 13,000
Chromosphere
- Region above the photosphere with bundles of magnetic field lines forming a web-like pattern
- 10,000 km thick
- Temperature (Kelvin) 5,000 (bottom of layer) to several hundred thousand (top of layer)
- Temperature (Fahrenheit) 8,500 – 350,000
Corona
- The region above the chromosphere
- Extends out several solar radii
- Temperature (Kelvin) as high as 2,000,000
- Temperature (Fahrenheit)as high as 3,600,000
A very good overview of the SDO mission can be seen in this video.
Another informative video of the Solar Dynamics Observatory
