US Nuclear Power Plants Fallout Map – Locations & Live Time Wind Flow

Looking for a U.S. nuclear power plants fallout map? I will explain why there is not one perfect map for this. However, I will recommend how-to, or what to do, for a fallout map based on your relative location to a nuclear power plant, and a map of Live-occurring wind fields.
A United States (or wherever) nuclear power plant disaster, or worst-case meltdown. Although nuclear reactors are apparently mostly incredibly safe, it’s a frightening scenario if a disaster were to occur. As you know, it has happened before…more than once. A nuclear reactor and its fallout.
Being preparedness-minded, you might pre-emptively consider how to know if nuclear fallout from a reactor might affect you and your location.

Fallout Map?
I wondered if there could be such a thing as a nuclear power plants fallout map.
I’ve authored a number of articles on the topic of nuclear reactors, and risk mitigation thereof. In the process, I’ve built several location maps of these nuclear reactors / power plants here in the U.S.
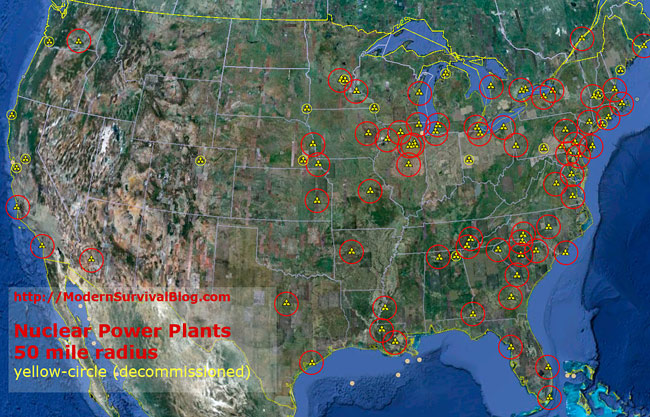
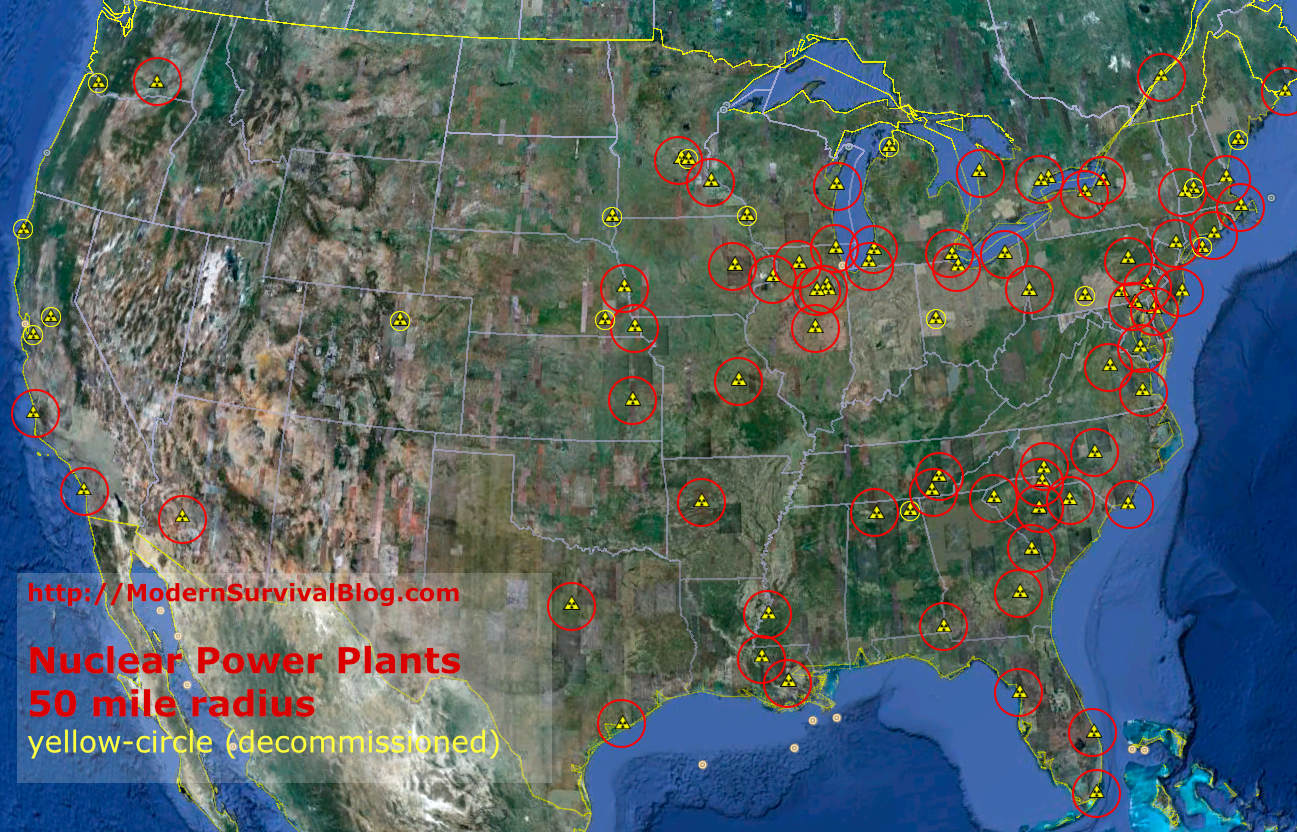
Here’s one that illustrates the location of all the operating nuclear power plants in the United States (I believe there are 104). I have added a 50 mile radius (100 mile diameter) circle around each one.
All fallout is not created equally. Without some kind of massive explosion, the really dangerous radioactive material will remain in the reactor.
With that said, I’ve chosen a 50-mile radius as a distance factor, given that generally any radioactive fallout will dissipate according to the inverse-square-law. The most dangerous radiation / fallout will likely remain much closer to the reactor than my chosen distance. However, the illustration provides geographical perspective.
Nuclear Power Plant Locations:

After some consideration, I realized that there’s a very important factor that very much affects any given hypothetical fallout map. What is that factor? (hint… it’s ‘variable’)
WIND and WIND DIRECTION Affects Fallout Risk
A key factor will be the wind patterns during the time of event. Wind direction, and wind speed. This WILL affect the fallout distribution.
Also, if fallout gets into the upper atmosphere (major explosion), then the radioactive particles will begin to distribute widely and will follow upper level wind patterns.
Live Wind Map of the United States to Help Figure Fallout Propagation
The idea here is to first know your geographical location with relation to the nuclear power plant in question. See map above.
Then, get on the internet and check the following live-time wind map as it relates to your general location. This will help you to estimate which way the fallout will be going. Towards you? Away from you?
Click and drag to move the map around. Unfortunately there are no state lines drawn on the map (it does show major rivers). But you should pretty much know where you are…
map embed source: earth.nullschool.net
Note: A long-term wide scale grid-down would be an entirely different scenario and outcome. There are a number of reasons why these nuclear reactors would not survive too terribly long without the grid. And we would all likely be in a world of hurt as a result. But that’s not the focus of this article…
Among the highest priorities for survival is safe drinking water.
AlexaPure Pro Gravity-Powered Water Filtration
Tested against NSF/ANSI 53, NSF/ANSI 42

