States With The Most Preppers as a Percentage of Population

Have you ever wondered which states might have the highest percentage of preppers as compared with their state population? This might shed some light on a given state’s demographic or its appeal to the preparedness-minded.
My method is somewhat unscientific. But it was interesting nonetheless. I did this just for fun. Here’s how I did it.
I ran a poll (original poll was back during 2016) asking our readers to let us know which state they live in. My assumption was if they’re reading this and responding to my poll – well, they’re probably a prepper (e.g. preparedness-minded) since they’re on this site.
I tallied all the votes for each state. Then, normalized the results according to that state’s population.
I know, I know… there are lots of holes in this method. But like I said, I thought it was interesting.
More than 1,000 people participated in the poll, What State Do You Live In, And Why (check that poll to see which states had the most respondents). I sorted the number of raw votes per state and charted them (see the referenced post for raw vote chart).
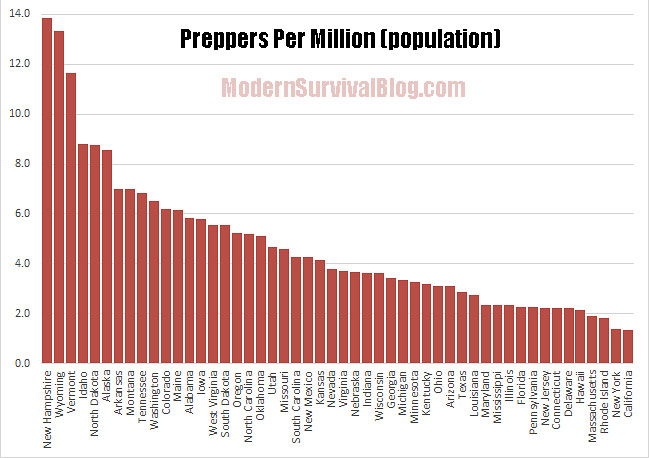
HOWEVER, each state has its own population statistic. To discover the representative ranking of states with the highest percentage of preppers (given each state’s population), I divided the votes by the population of each state and then came up with a number of ‘preppers per million’ of those who participated in the poll…
In other words, the results have been ‘normalized’ to the population of each state (naturally, you would expect more ‘votes’ from a state with 27 million people than from a state with 1 million people).
I know, this does not reveal an accurate preppers-per-million among any given state population (because not everyone in the state is participating in this poll!). However the poll will reveal at least a hint…
With that said, here are the ‘normalized’ results:
Ordered List of States, Number of Preppers Per Population
STATE – VOTES/POPULATION (PPM of poll participants)
1. New Hampshire (13.8)
2. Wyoming (13.3)
3. Vermont (11.7)
4. Idaho (8.8)
5. North Dakota (8.8)
6. Alaska (8.6)
7. Arkansas (7.0)
8. Montana (7.0)
9. Tennessee (6.8)
10. Washington (6.5)
11. Colorado (6.2)
12. Maine (6.2)
13. Alabama (5.8)
14. Iowa (5.8)
15. West Virginia (5.6)
16. South Dakota (5.6)
17. Oregon (5.3)
18. North Carolina (5.2)
19. Oklahoma (5.1)
20. Utah (4.7)
21. Missouri (4.6)
22. South Carolina (4.3)
23. New Mexico (4.3)
24. Kansas (4.1)
25. Nevada (3.8)
26. Virginia (3.7)
27. Nebraska (3.7)
28. Indiana (3.6)
29.Wisconsin (3.6)
30. Georgia (3.4)
31. Michigan (3.3)
32. Minnesota (3.3)
33. Kentucky (3.2)
34. Ohio (3.1)
35. Arizona (3.1)
36. Texas (2.9)
37. Louisiana (2.8)
38. Maryland (2.3)
39. Mississippi (2.3)
40. Illinois (2.3)
41. Florida (2.3)
42. Pennsylvania (2.3)
43. New Jersey (2.2)
44. Connecticut (2.2)
45. Delaware (2.2)
46. Hawaii (2.1)
47. Massachusetts (1.9)
48. Rhode Island (1.8)
49. New York (1.4)
50. California (1.3)
| STATE | VOTES | POPULATION | votes/pop |
| Texas | 79 | 27,500,000 | 2.9 |
| North Carolina | 52 | 10,000,000 | 5.2 |
| California | 52 | 39,100,000 | 1.3 |
| Washington | 47 | 7,200,000 | 6.5 |
| Florida | 46 | 20,300,000 | 2.3 |
| Tennessee | 45 | 6,600,000 | 6.8 |
| Ohio | 36 | 11,600,000 | 3.1 |
| Georgia | 35 | 10,200,000 | 3.4 |
| Colorado | 34 | 5,500,000 | 6.2 |
| Michigan | 33 | 9,900,000 | 3.3 |
| Virginia | 31 | 8,400,000 | 3.7 |
| Illinois | 30 | 12,900,000 | 2.3 |
| Pennsylvania | 29 | 12,800,000 | 2.3 |
| Alabama | 28 | 4,800,000 | 5.8 |
| Missouri | 28 | 6,100,000 | 4.6 |
| New York | 27 | 19,800,000 | 1.4 |
| Indiana | 24 | 6,600,000 | 3.6 |
| Arkansas | 21 | 3,000,000 | 7.0 |
| Oregon | 21 | 4,000,000 | 5.3 |
| South Carolina | 21 | 4,900,000 | 4.3 |
| Wisconsin | 21 | 5,800,000 | 3.6 |
| Arizona | 21 | 6,800,000 | 3.1 |
| Oklahoma | 20 | 3,900,000 | 5.1 |
| New Jersey | 20 | 9,000,000 | 2.2 |
| New Hampshire | 18 | 1,300,000 | 13.8 |
| Iowa | 18 | 3,100,000 | 5.8 |
| Minnesota | 18 | 5,500,000 | 3.3 |
| Idaho | 15 | 1,700,000 | 8.8 |
| Utah | 14 | 3,000,000 | 4.7 |
| Kentucky | 14 | 4,400,000 | 3.2 |
| Maryland | 14 | 6,000,000 | 2.3 |
| Louisiana | 13 | 4,700,000 | 2.8 |
| Massachusetts | 13 | 6,800,000 | 1.9 |
| Kansas | 12 | 2,900,000 | 4.1 |
| Nevada | 11 | 2,900,000 | 3.8 |
| West Virginia | 10 | 1,800,000 | 5.6 |
| New Mexico | 9 | 2,100,000 | 4.3 |
| Wyoming | 8 | 600,000 | 13.3 |
| Maine | 8 | 1,300,000 | 6.2 |
| Connecticut | 8 | 3,600,000 | 2.2 |
| Vermont | 7 | 600,000 | 11.7 |
| North Dakota | 7 | 800,000 | 8.8 |
| Montana | 7 | 1,000,000 | 7.0 |
| Nebraska | 7 | 1,900,000 | 3.7 |
| Mississippi | 7 | 3,000,000 | 2.3 |
| Alaska | 6 | 700,000 | 8.6 |
| South Dakota | 5 | 900,000 | 5.6 |
| Hawaii | 3 | 1,400,000 | 2.1 |
| Delaware | 2 | 900,000 | 2.2 |
| Rhode Island | 2 | 1,100,000 | 1.8 |
