Drought Map US – Latest Drought Updates For The United States

Drought is a hazard of nature. You may be interested to look at an up-to-date US drought map.
(Realtime US Drought Maps are embedded below)
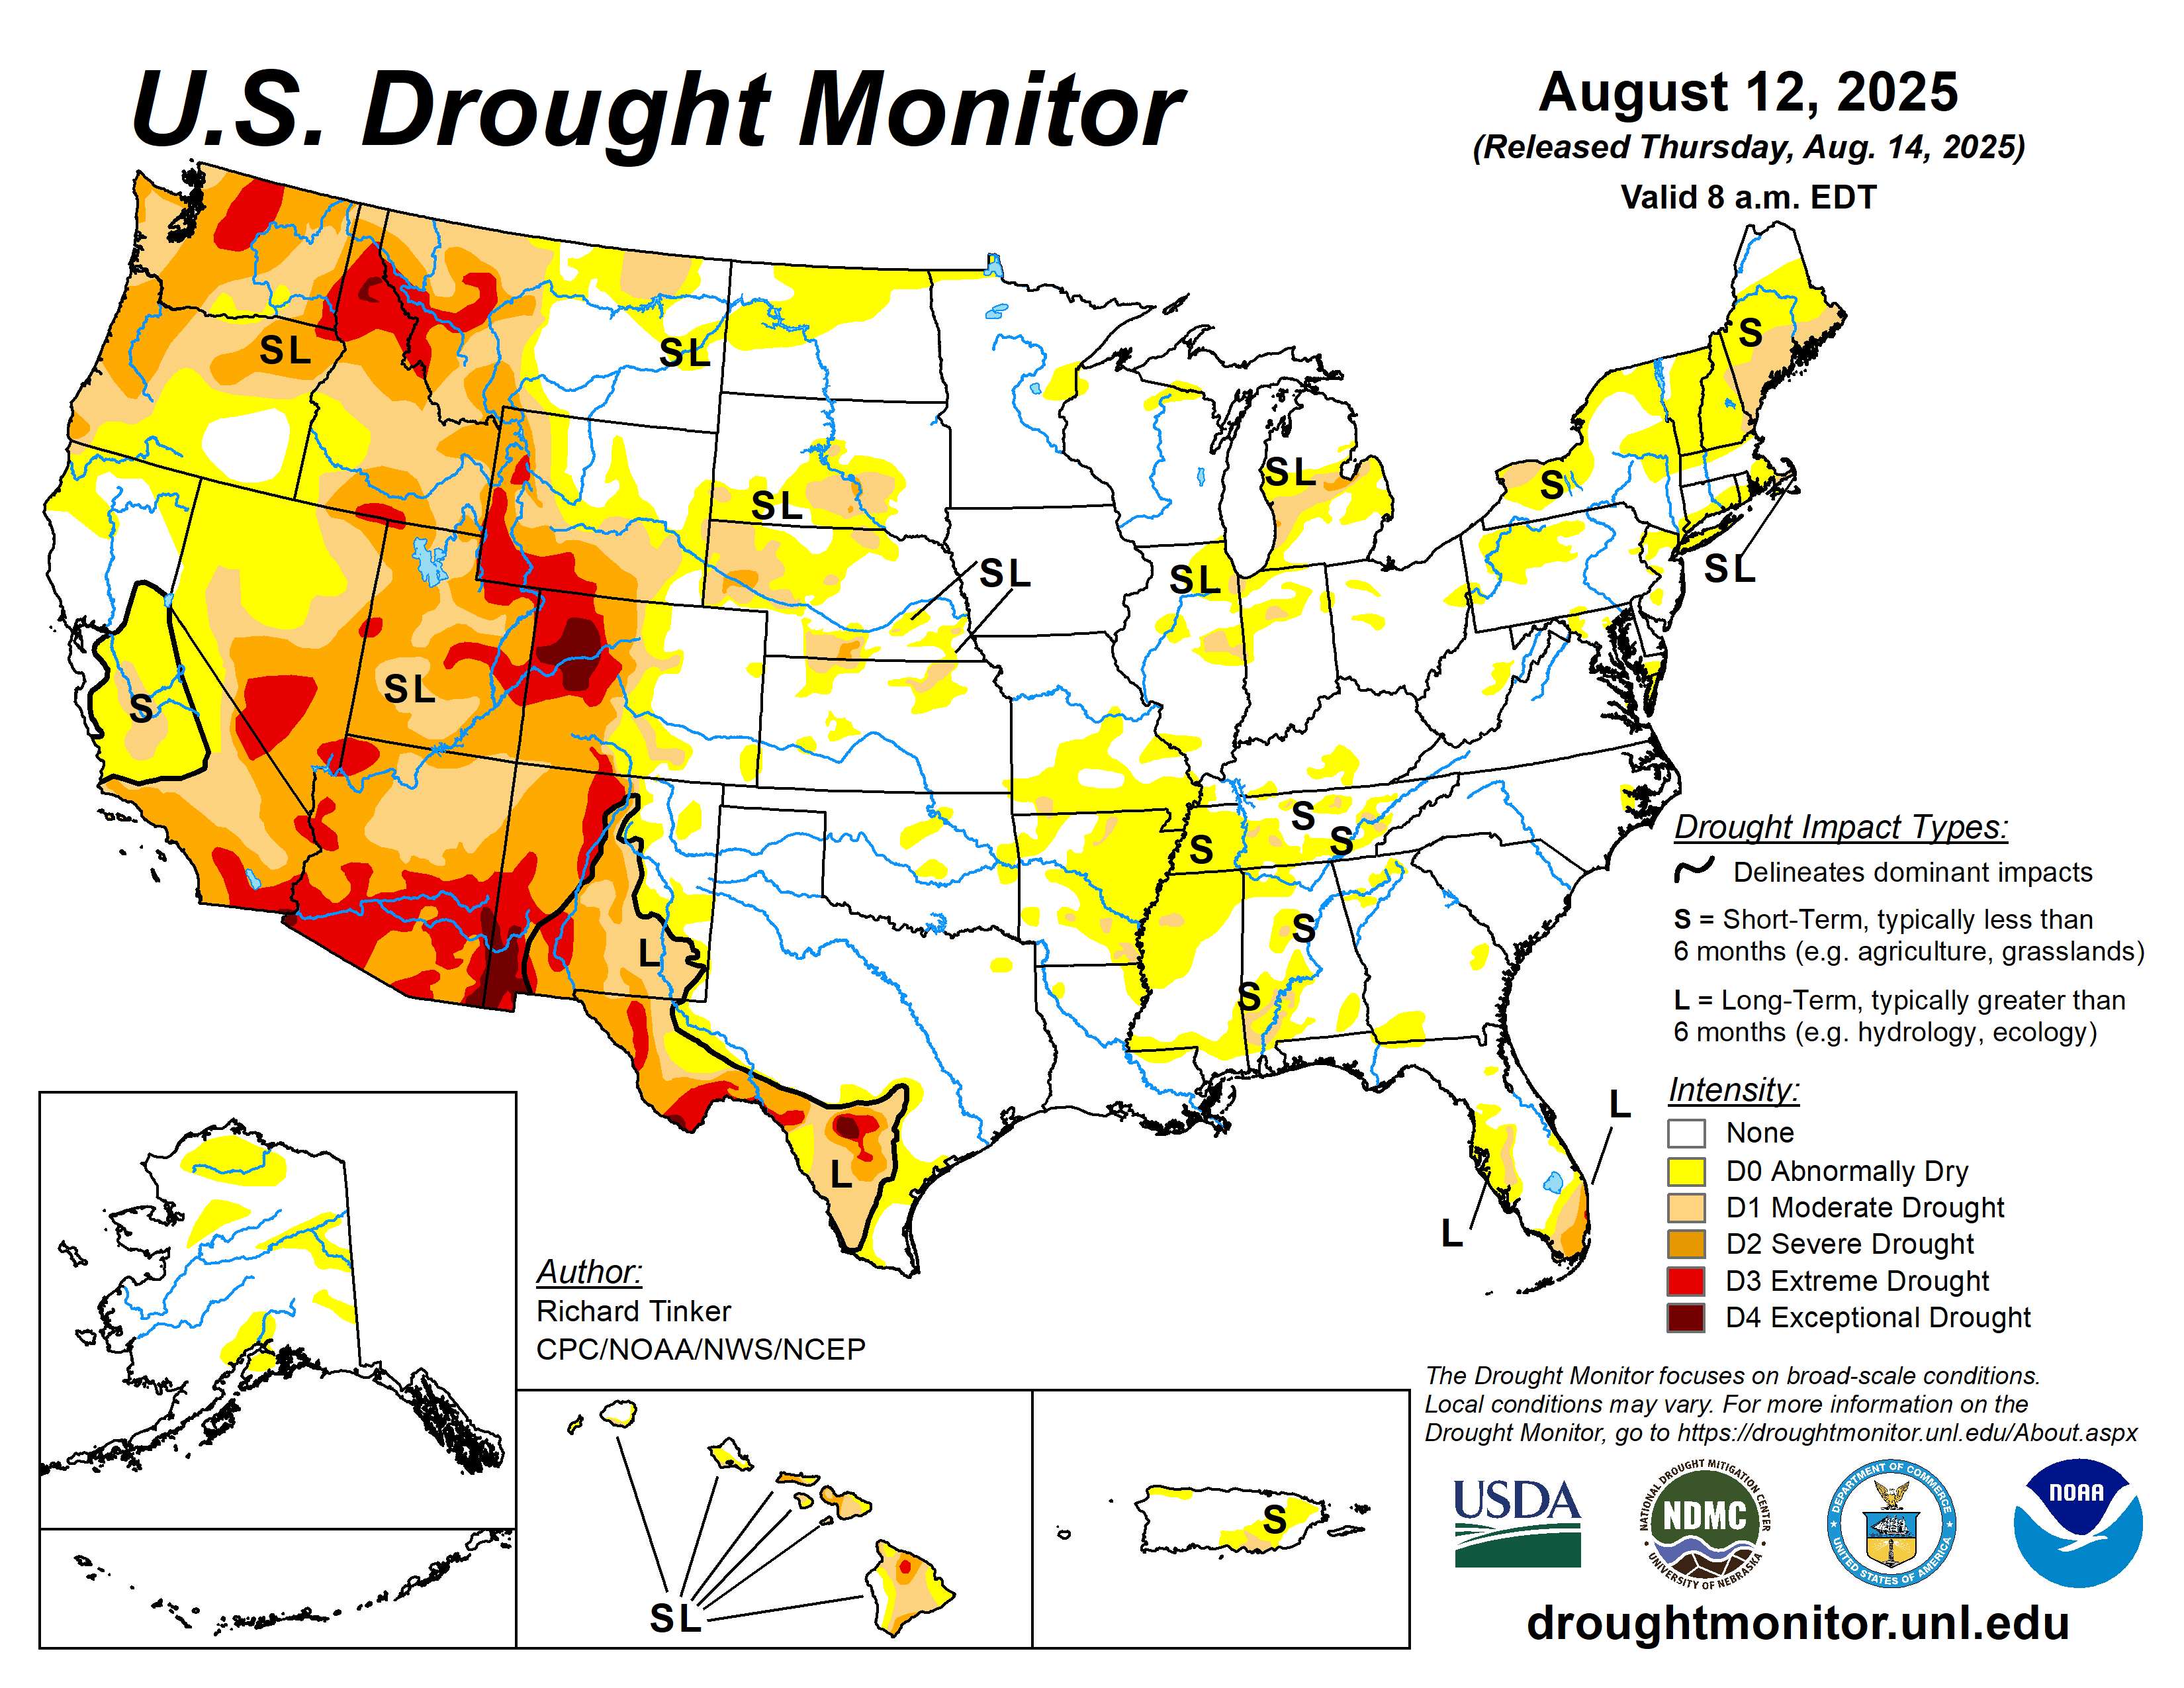
The following are drought map embeds from a variety of sources presenting their latest data for the United States. As I update this post, there are many regions within the US under Extreme, and Exceptional drought. Texas, California, and more (just look at the map). It’s pretty obvious that there are going to be devastating crop losses and downstream negative effects, given what I see during this late-summer update.
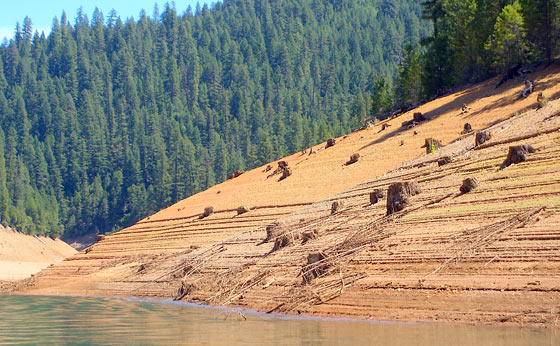
Additionally, as I’m sure you know, many of the lakes, reservoirs, and rivers in western affected regions are alarmingly low. Millions upon millions depend on these sources for water. Is there a major disaster looming in this regard? I’m sure that lots of wells are going dry too…
Regarding crop failure observations due to drought, a reader on the blog reported,
Drove I-90 for a good chunk of the trip. All I’ll say about that is stock up on any animal feed that involves corn, especially. With the exception of a region of SW WI/NE IA, it did not look good. Tassels are starting or open, and if it doesn’t rain soon…… Same for what I saw from the interstate through the great plains. The green spots were there due to irrigation, and mostly for hay/small grazing areas.
~ Farmgirl
Add your own drought observations in the comments below.
More about drought:
A drought does not announce its arrival. It’s a “creeping phenomenon,”. What may first appear to be just a dry spell can only be recognized in hindsight as the early days of a drought.
Generally speaking, a drought is defined as a deficiency of precipitation over an extended period of time(usually a season or more), resulting in a water shortage.
A number of factors may influence the onset of drought, or it’s continuation. Long term weather patterns. Storm-track variations. The Madden–Julian oscillation (MJO). El-Nino. La-Nina. The Sun – solar variability. Deep ocean circulation. And other cyclical events that occur naturally here on earth.
Drought Intensity
There are several categories of drought intensity.
- Abnormally Dry
- Moderate Drought
- Severe Drought
- Extreme Drought
- Exceptional Drought
Drought Impacts
The impact of drought are many, and include the geographical-environmental, agricultural, social, and economic.
Drought is obviously a high concern for farmers, those growing their own food, those dependent upon reservoirs being replenished to supply municipal systems, the animals and eco-systems, just to name a few…
I had my own personal impact last year when my region was technically in drought. I rely on a natural spring for my water source. Normally it wells up at about 7 – 10 gallons per minute. However it had slowed down to about 3 gallons per minute. It was still plenty for our homestead needs, but I did start to get a bit nervous about it…
The risk of drought is greater in some regions more than others. If you live in a drought-prone region, you probably already know it or have experienced it…
As of this post date, large regions of the southwest United States are in extreme drought or exceptional drought.
For your interest I have embedded several US drought maps. They will auto-update to the latest images regardless of this article’s post date.
Drought Maps of the US
Drought Map – droughtmonitor.unl.edu

USA Monthly Drought Map – Month Outlook
“Drought Tendency” (Monthly)

United States Drought Map – Seasonal Outlook
“Drought Tendency” (Seasonal)

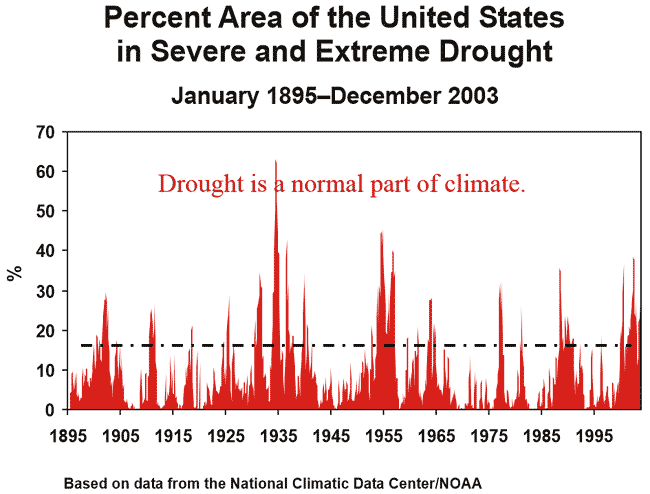
United States Drought History
The use of tree ring methodology has revealed that the characterization of drought has been a normal part of climate throughout our history.

[ Read: United States Aquifer Locations ]
