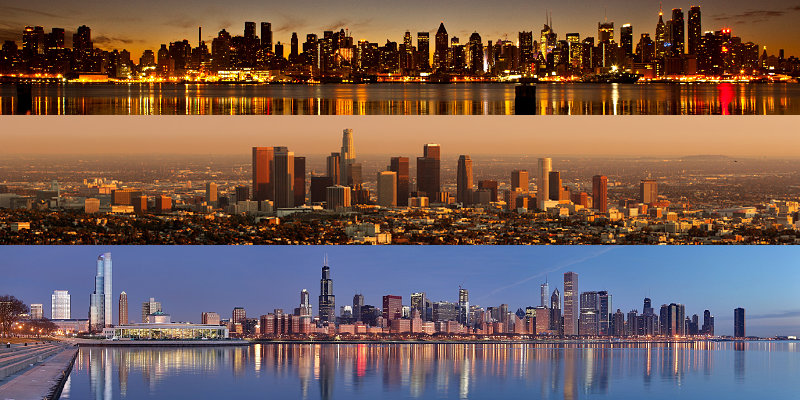
USA Urban Areas List and Population
Based on 2020 census data, and updated urban area definition, approximately 80% of the US population technically live in an urban area. That leaves about 20% who technically live in rural areas. I find that to be quite interesting. Here’s some statistics and information about USA urban areas, lists, names, visual graphs, population, and source links.
According to data for census.gov, as of 2020, there were (rounded) 268 million Americans living in urban classified areas. A quick check of the US population today (early 2023), there are 334 million people living in the United States.
Urban areas are clusters of development that meet a minimum population density threshold. Here’s the updated technical definition:
Urban Areas Criteria
Q: What is the definition of an urban area?
A: Urban areas represent densely developed territory, and encompass residential, commercial, and
other nonresidential urban land uses. Each urban area must encompass at least 2,000 housing units or
at least 5,000 people. This is a change from the previous minimum of 2,500 people which had been in
place since the 1910 Census.Urban areas are defined primarily based on housing unit density measured at the census block level.
Three housing unit densities are applied during the delineation process:(source PDF from census.gov)
- Initial urban core: at least 425 housing units persquare mile. Based on the national average of
2.6 people per occupied housing unit, this density threshold is similar to the 1,000 people per
square mile used in 2000 and 2010 when delineating initial urban cores.- Remainder of urban area: at least 200 housing units per square mile. This is similar to the 500
people per square mile density used for the 2000 and 2010 Censuses, based on the national
average of 2.6 people per occupied housing unit.- At least one high-density nucleus of at least 1,275 housing units per square mile required for
qualification. This ensures that each urban area contains a high-density nucleus typical of what
one would expect to find within an urban area. In addition to the change in minimum thresholds
for qualification and the change to use of housing unit density, the Census Bureau also will no
longer distinguish between urbanized areas of 50,000 or more people and urban clusters of less
than 50,000 people.
I downloaded a spreadsheet that lists all 2,645 urban areas in the US. Then I started playing with the numbers, and illustrating them with charts and graphs. Here are some interesting statistical results:
Nearly 30% of all the people living in urban areas live in just 10 of them.
Nearly 70% of all people living in urban areas live in the Top 100.
82% of urbanites live in the Top 250, while nearly 90% live in the Top 500 urban areas.
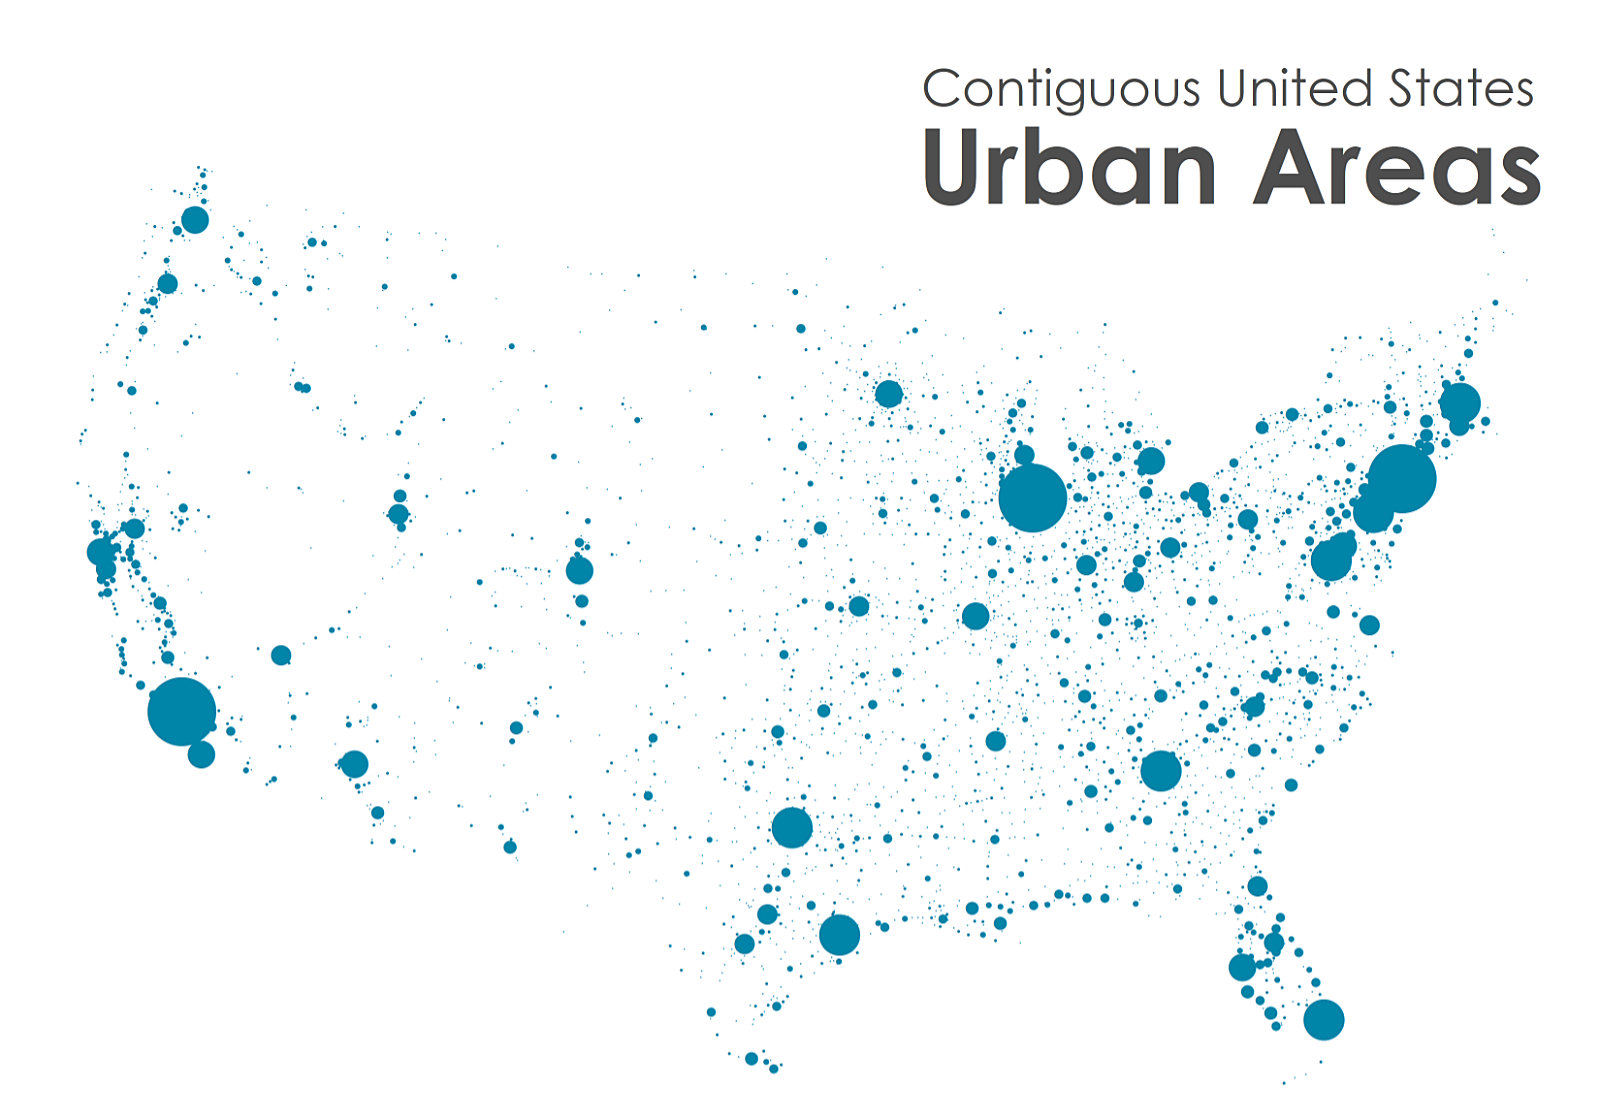
Here’s an interesting representation urban areas map of the contiguous United States. I came across it during my research. I like the map because it proportionally shows where people live within all of the urban areas (size of the circles).
Image source credit: Dan Malouff (transportation planner for Arlington and an adjunct professor at George Washington University).
And here’s a list of the Top 100 urban areas in the United States, and their population, where nearly 70% or all the urbanites live…
1 New York–Jersey City–Newark, NY–NJ 19,426,449
2 Los Angeles–Long Beach–Anaheim, CA 12,237,376
3 Chicago, IL–IN 8,671,746
4 Miami–Fort Lauderdale, FL 6,077,522
5 Houston, TX 5,853,575
6 Dallas–Fort Worth–Arlington, TX 5,732,354
7 Philadelphia, PA–NJ–DE–MD 5,696,125
8 Washington–Arlington, DC–VA–MD 5,174,759
9 Atlanta, GA 4,999,259
10 Boston, MA–NH 4,382,009
11 Phoenix–Mesa–Scottsdale, AZ 3,976,313
12 Detroit, MI 3,776,890
13 Seattle–Tacoma, WA 3,544,011
14 San Francisco–Oakland, CA 3,515,933
15 San Diego, CA 3,070,300
16 Minneapolis–St. Paul, MN 2,914,866
17 Tampa–St. Petersburg, FL 2,783,045
18 Denver–Aurora, CO 2,686,147
19 Riverside–San Bernardino, CA 2,276,703
20 Baltimore, MD 2,212,038
21 Las Vegas–Henderson–Paradise, NV 2,196,623
22 St. Louis, MO–IL 2,156,323
23 Portland, OR–WA 2,104,238
24 San Antonio, TX 1,992,689
25 Sacramento, CA 1,946,618
26 Orlando, FL 1,853,896
27 San Juan, PR 1,844,410
28 San Jose, CA 1,837,446
29 Austin, TX 1,809,888
30 Pittsburgh, PA 1,745,039
31 Cleveland, OH 1,712,178
32 Indianapolis, IN 1,699,881
33 Cincinnati, OH–KY 1,686,744
34 Kansas City, MO–KS 1,674,218
35 Columbus, OH 1,567,254
36 Virginia Beach–Norfolk, VA 1,451,578
37 Charlotte, NC–SC 1,379,873
38 Milwaukee, WI 1,306,795
39 Providence, RI–MA 1,285,806
40 Jacksonville, FL 1,247,374
41 Salt Lake City, UT 1,178,533
42 Nashville-Davidson, TN 1,158,642
43 Raleigh, NC 1,106,646
44 Richmond, VA 1,059,150
45 Memphis, TN–MS–AR 1,056,190
46 Oklahoma City, OK 982,276
47 Hartford, CT 977,158
48 Louisville/Jefferson County, KY–IN 974,397
49 Buffalo, NY 948,864
50 Bridgeport–Stamford, CT–NY 916,408
51 New Orleans, LA 914,531
52 Tucson, AZ 875,441
53 El Paso, TX–NM 854,584
54 Honolulu, HI 853,252
55 Omaha, NE–IA 819,508
56 McAllen, TX 779,553
57 Bradenton–Sarasota–Venice, FL 779,075
58 Birmingham, AL 774,956
59 Albuquerque, NM 769,837
60 Tulsa, OK 722,810
61 Fresno, CA 717,589
62 Rochester, NY 704,327
63 Charleston, SC 684,773
64 Dayton, OH 674,046
65 Mission Viejo–Lake Forest–Laguna Niguel, CA 646,843
66 Colorado Springs, CO 632,494
67 Baton Rouge, LA 631,326
68 Allentown–Bethlehem, PA–NJ 621,703
69 Ogden–Layton, UT 608,857
70 Grand Rapids, MI 605,666
71 Cape Coral, FL 599,242
72 Knoxville, TN 597,257
73 Albany–Schenectady, NY 593,142
74 Columbia, SC 590,407
75 Provo–Orem, UT 588,609
76 Bakersfield, CA 570,235
77 New Haven, CT 561,456
78 Des Moines, IA 542,486
79 Akron, OH 541,879
80 Concord–Walnut Creek, CA 538,583
81 Temecula–Murrieta–Menifee, CA 528,991
82 Palm Bay–Melbourne, FL 510,675
83 McKinney–Frisco, TX 504,803
84 Wichita, KS 500,231
85 Toledo, OH–MI 497,952
86 Harrisburg, PA 490,859
87 Worcester, MA–CT 482,085
88 Little Rock, AR 461,864
89 Madison, WI 450,305
90 Spokane, WA 447,279
91 Reno, NV–CA 446,529
92 Springfield, MA–CT 442,145
93 Port St. Lucie, FL 437,745
94 Boise City, ID 433,180
95 Augusta-Richmond County, GA–SC 431,480
96 Denton–Lewisville, TX 429,461
97 Bonita Springs–Estero, FL 425,675
98 Winston-Salem, NC 420,924
99 Phoenix West–Goodyear–Avondale, AZ 419,946
100 Kissimmee–St. Cloud, FL 418,404
I found the following map to be fascinating. It’s a PDF (14 MB) file that you can really zoom in on, which shows all of the various ‘urban areas’. It’s too big to paste into this article, but you can look at it or download yourself from this link at census.gov.
Why do I find all this interesting?
Well, for a number of reasons. One of them being that we talk about (occasionally here on the blog) the varying risks/system-risks associated with living in population-dense regions. Seeing it visualized, reading the statistics about where the majority of people live, it sheds light on many things.
For example, the fact that politics and subsequent laws and governance of such urban areas do highly influence and often dictate those of rural regions (because most people live in urban areas). Lifestyles and politics can be, and often are, very different between urban areas and rural. High population densities create unique problems and issues, whereas rural folks will typically ‘get along’ without an overabundance of oversight.
And of course, should there ever be systemic breakdowns of infrastructure, urban areas will be the first to hit-the-fan. And right quickly. In my view, it is unnatural to live so tightly packed together. But I do understand how and why it is. Anyway, this has simply been another presentation of perspective on population and where people live…
Another source link:
https://www.census.gov/programs-surveys/geography/guidance/geo-areas/urban-rural.html
[ Read: Timeline Of Events Following A Long Term Grid Down Catastrophe ]